之前分享过matlab自定义lut来显示显微图片的文章(matlab自定义lut,用于展示显微图片,得到colorbar)
这次分享下matlab如何自定义colormap、如何单独展示colormap以及最后分享自己的colormap github地址。
Matlab 如何自定义colormap
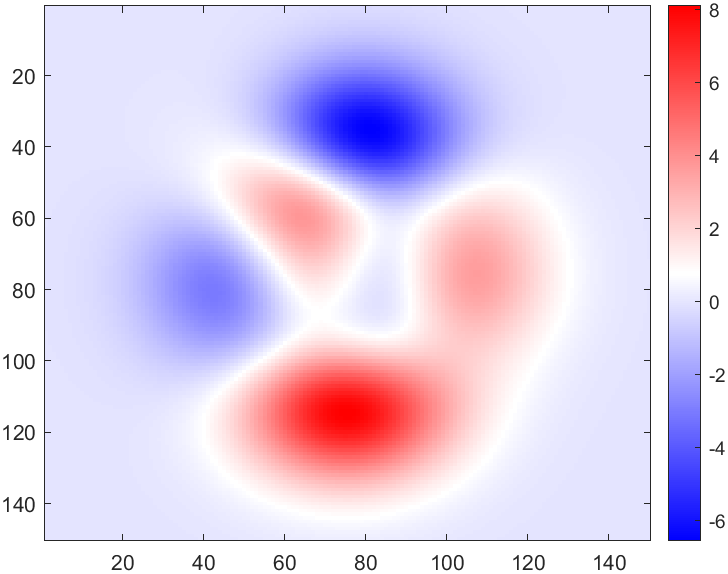
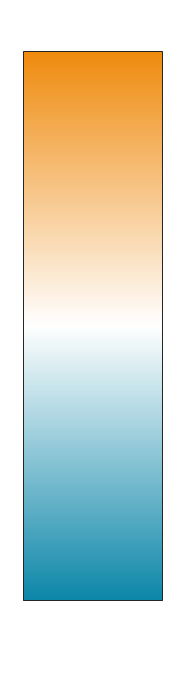
确定好最低值到最大值要使用的颜色,比如这里设置最低值使用青色,最大值使用橙色,中间值使用白色。
1 | colors = [13,135,169;... |
进行插值
1 | % Use linear interpolation to create the colormap |
绘制这个colormap
1 | f=figure; |
全部代码
1 | colors = [13,135,169;... |
其他例子
-
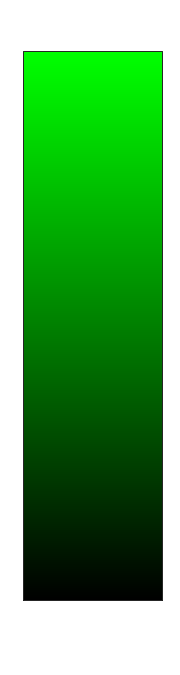
最亮为绿色,最暗为黑色的colormap
1
2
3
4
5
6
7
8
9
10
11
12
13
14
15colors = [0 ,0,0;0,255,0;] ./ 255;
% Use linear interpolation to create the colormap
x = linspace(0, 1, size(colors, 1)); % 原来的数量
n = 256;
xi = linspace(0, 1, n); % 插值的数量
cm = interp1(x, colors, xi, 'linear');
f=figure;
f.Position(3)=30;
f.Position(4)= 450;
n=256;
imagesc((n:-1:1)');
set(gca, 'YTick', [], 'XTick', []);
colormap(cm);
-
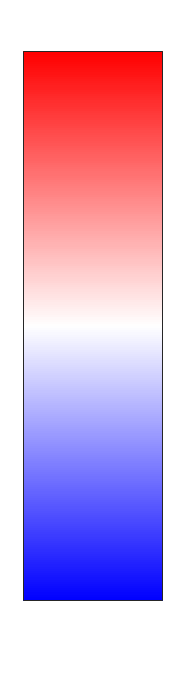
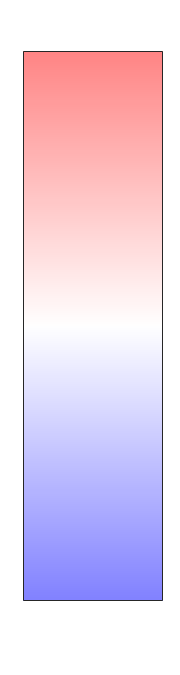
最亮为红色,最暗为蓝色的colormap
深色版本
1
2
3
4
5
6
7
8
9
10
11
12
13
14
15
16
17
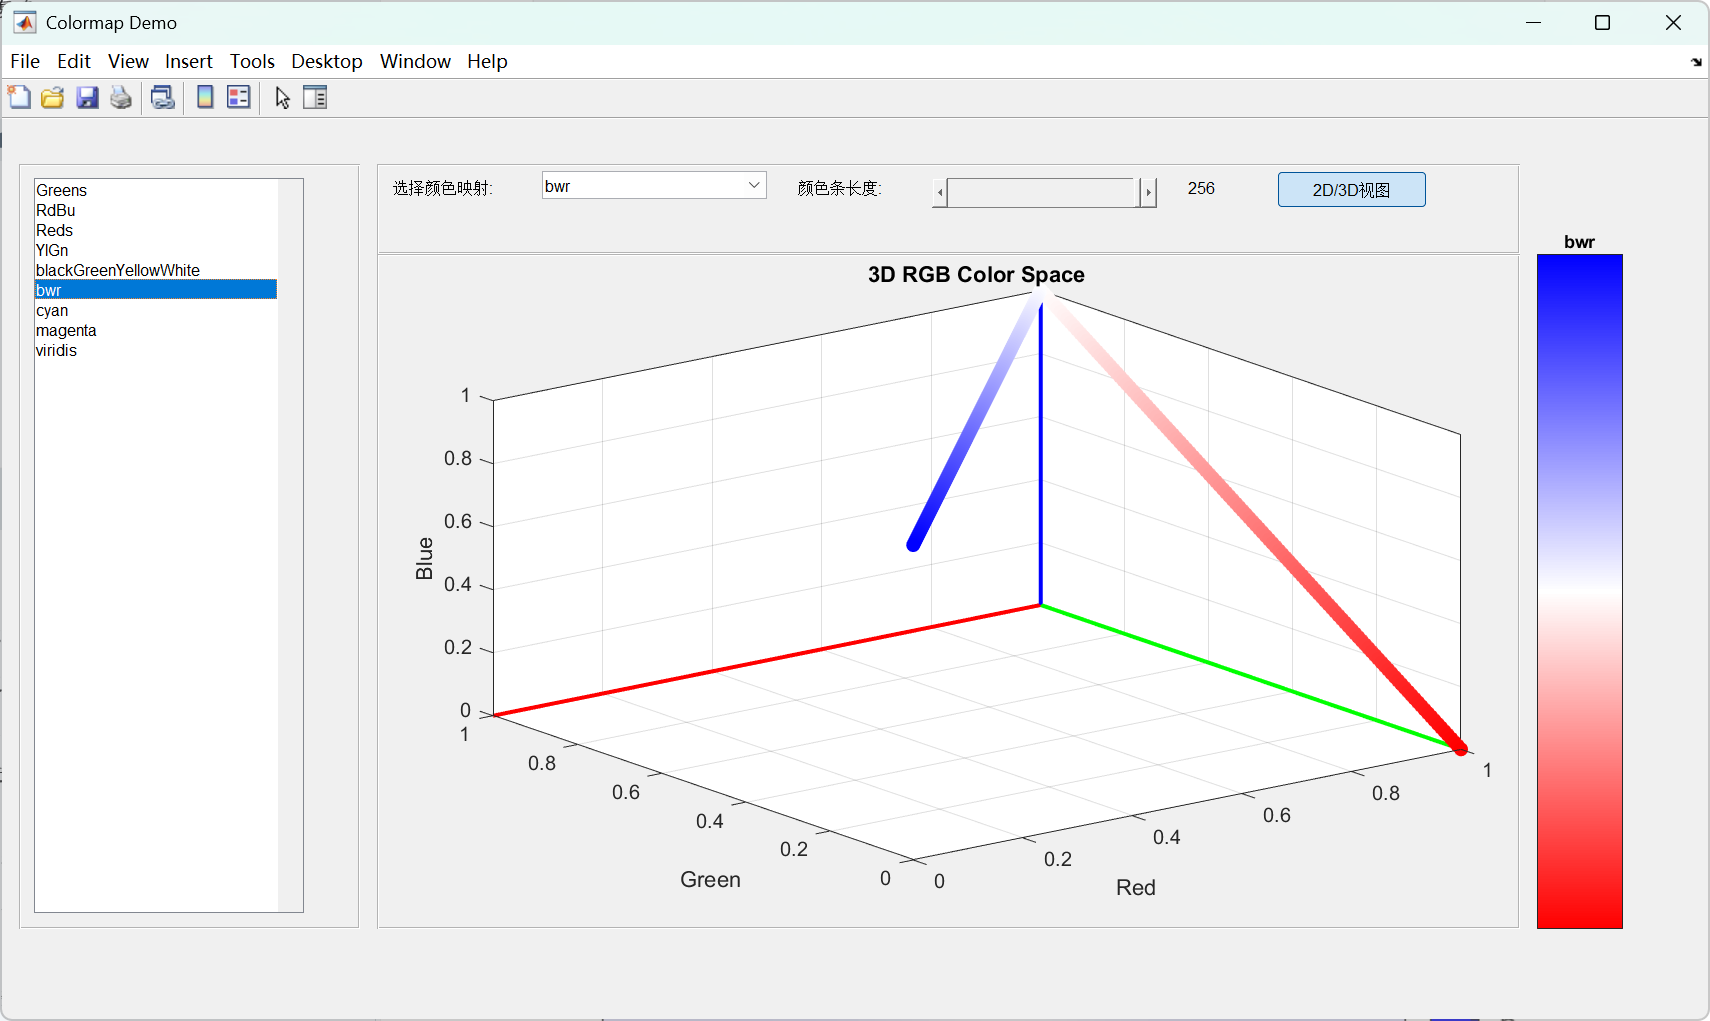
18colors = [0,0,255;...
255,255,255;...
255,0,0] ./ 255;
% Use linear interpolation to create the colormap
x = linspace(0, 1, size(colors, 1)); % 原来的数量
n = 256;
xi = linspace(0, 1, n); % 插值的数量
cm = interp1(x, colors, xi, 'linear');
f=figure;
f.Position(3)=30;
f.Position(4)= 450;
n=256;
imagesc((n:-1:1)');
set(gca, 'YTick', [], 'XTick', []);
colormap(cm);
淡色版本
1 | colors = [130,130,255;... |
-
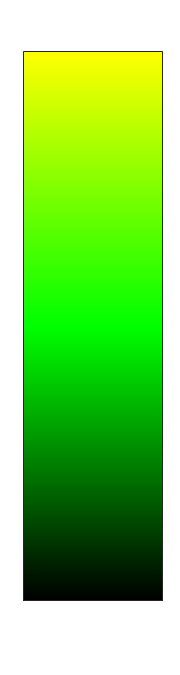
最亮为黄色,中间为绿色,最暗为黑色
1
2
3
4
5
6
7
8
9
10
11
12
13
14
15
16
17
18colors = [0,0,0;...
0,255,0;...
255,255,0] ./ 255;
% Use linear interpolation to create the colormap
x = linspace(0, 1, size(colors, 1)); % 原来的数量
n = 256;
xi = linspace(0, 1, n); % 插值的数量
cm = interp1(x, colors, xi, 'linear');
f=figure;
f.Position(3)=30;
f.Position(4)= 450;
n=256;
imagesc((n:-1:1)');
set(gca, 'YTick', [], 'XTick', []);

colormap(cm);
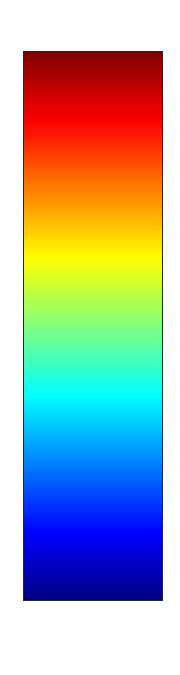
Matlab 如何单独绘制colormap
绘制单个,竖着
1 | f=figure; |
横着
1 | f=figure; |

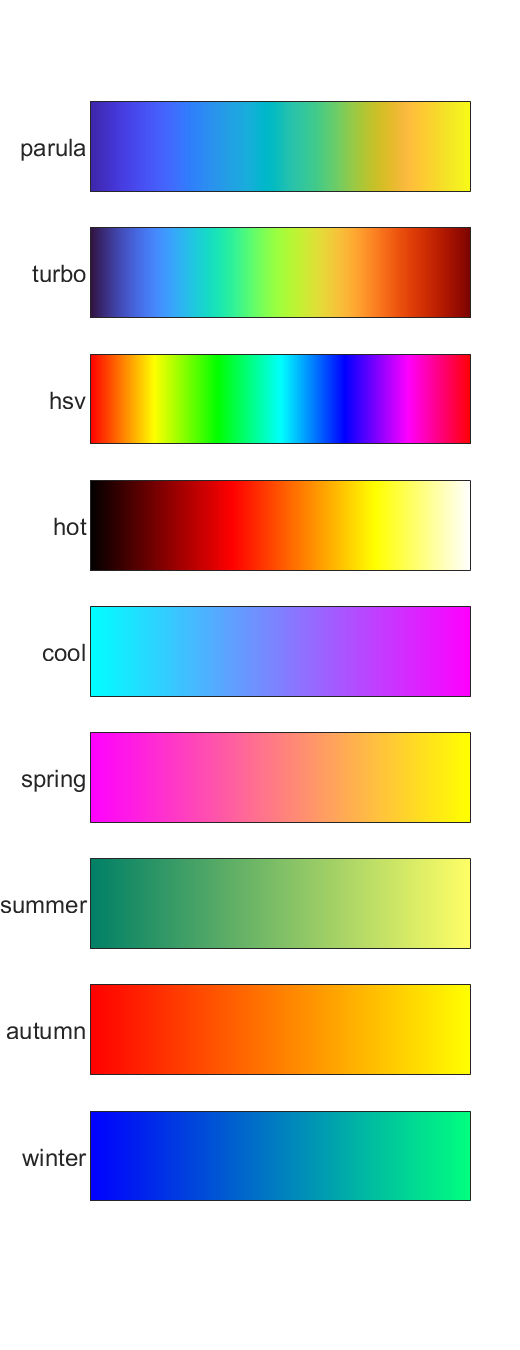
绘制多个colormap
1 | cmapNames = {"parula","turbo","hsv","hot","cool","spring","summer","autumn","winter"}; |
我用的自定义Colormap
在Github上开源了自己用的colormap,
reppo地址:Achuan-2/mycolormap
会随着使用慢慢增加实用的colormap
预览
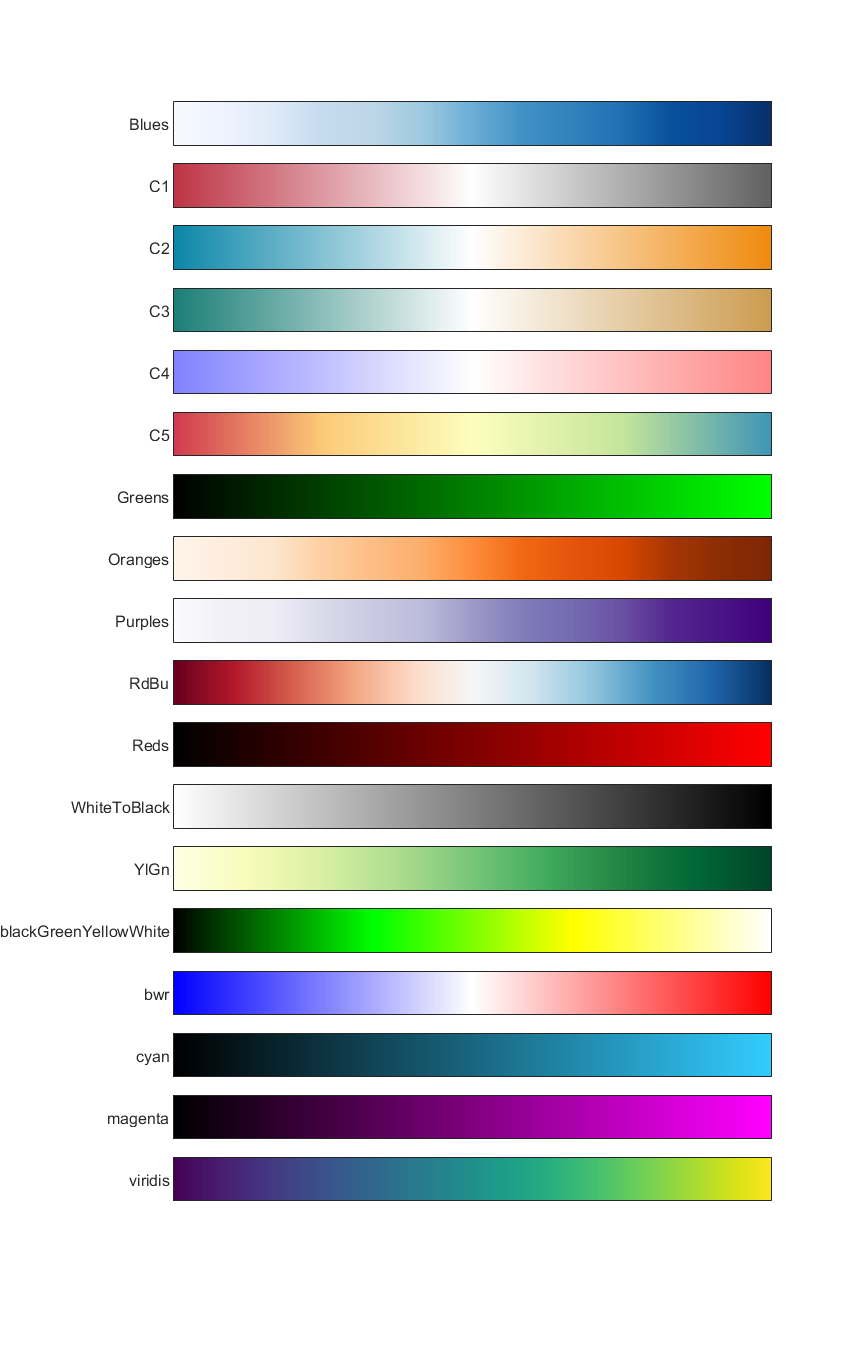
内置了预览功能
1 | mycolormap.preview |
目前全部的colormap
使用
1 | f=figure; |